Floods · explainer · 16 October 2026
How a flood is made
Barcelona's wettest day since its complete record began in 1978 came when three things lined up: a sea after its warmest September in 87 years, a pool of cold Atlantic air, and a wind driving moist air onshore.
Rain
How much is 159 millimetres?
On 3 October the Fabra observatory in Barcelona measured 159.1 mm of rain. One millimetre of rain is one litre on every square metre.
So a one-metre square of ground at the gauge took 159 litres in a day. For scale only: a full bath holds around 150.
That is the wettest day at Fabra in its complete record, which starts in 1978.
Rain like that needs three things at once: warm water to feed it, a way to lift it, and something to set it off. Here is how they lined up.
Heat
How hot did the summer get?
September was warm across Europe, but the sea was the outlier. The western and central Mediterranean had their warmest September in a record going back to 1940: 2.4 °C and 2.8 °C above the 1991 to 2020 normal.
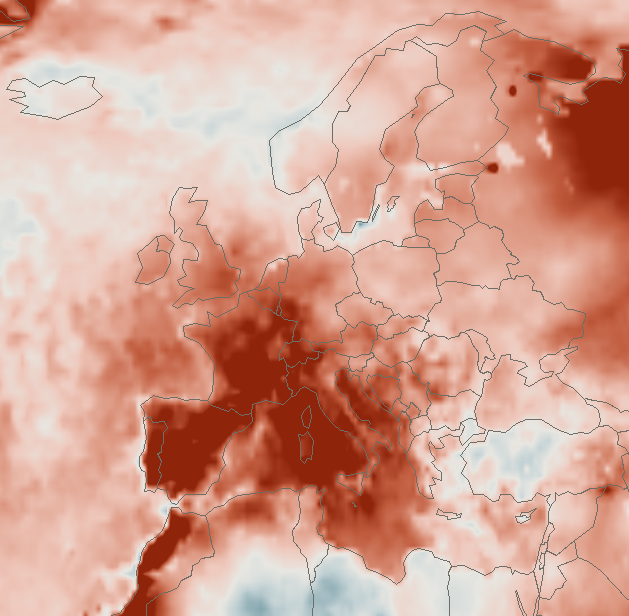
Sea
Where did the water come from?
The western Mediterranean averaged 26.0 °C in September. Normal is 23.6. That is the record. Rain on this coast starts as sea water, lifted into the air.
Temperatures measured: western Mediterranean (Alboran, Balearic, Gulf of Lion), September mean, ERA5; 2026 is the warmest September in a record going back to 1940 (1 of 87). The motion is illustrative: the warmer sea is drawn with a heat shimmer and slightly denser vapour, not to a measured rate.
Air
How much water can air hold?
The air held more water too. Across the whole planet, not just Spain, September 2026 carried more water vapour than any September in a record going back to 1940, 6.5% above normal. Warmer air holds about 7% more water for each degree.
Global total column water vapour, area-weighted, ERA5. About 7% more water vapour per degree C of warming (Clausius-Clapeyron; IPCC AR6 WG1 ch. 8).
Pump
What lifted it and set it off?
27 September. Five kilometres up, a pool of unusually cold air is sitting over the Atlantic.
29 September. At its deepest it is 15.9 °C colder than normal for the date, far out over the ocean.
30 September. It swings toward Iberia, still 11.7 °C colder than normal, out in the Atlantic north-west of Galicia.
1 October. It weakens and breaks up, leaving a shallow dip in the air over Spain.
3 October. A kilometre and a half up, the wind off Barcelona blows in from the south-east at 10 metres a second, off a sea that had just had its warmest September in 87 years.
Ground
Why does wet ground matter?
The ground is the part still in place. In the second week of October, topsoil from the Ebro delta to Murcia was wetter than normal for the date. Around the Ebro delta it was 55% above normal, the second wettest in 36 years. Ibiza was the exception, drier than usual. Ground that is already wet takes in less of the next rain.
Dry groundsoaks the rain in
Already wetfills, and the rest runs off
River
River
Hour 0 of 24Same rain on both · illustrative · not to scale
Weekend
What does this weekend look like?
The same ingredients are lining up again in ECMWF's forecast for this weekend: first the cold air and the wind, as the European centre's model sees them. It is their forecast, not ours. Then the map: where floods have hit this coast before, how wet the ground is now, and AEMET's warnings as they are issued.
This weekendThe same layers, in ECMWF's forecast. Run 2026-10-16 00:00 UTC. Not a forecast of ours.
18 October. In ECMWF's forecast, a new cold pool drops over France, about 10 °C colder than normal. Unlike the first storm, its edge reaches over Spain, 4 to 5 °C colder.
19 October. In the forecast, the wind a kilometre and a half up turns onshore at Barcelona, from the south-east at 11 metres a second, over the warm sea.
Floods since 1982Damaging floods on this coast, by year. A selection, not a ranking; markers place each at a named town, not its extent. HANZE v2.1 to 2020 (Paprotny et al. 2024); 2024 from named news sources.
Wet ground, nowTopsoil after the first storm, filled where it is among the wettest third of 36 years for the date, darker the higher it ranks; outlined areas are within the usual range. ERA5, top 7 cm, 8 to 10 October.
AEMET's warningsAEMET's rain and thunderstorm warnings for 17 to 20 October, drawn at the level AEMET set. Issued up to 2026-10-15 21:50 UTC. Source: AEMET OpenData (Meteoalerta).
Not a forecast of ours, and no combined score: each layer is shown as its source published it.
We find climate signals in the data, and send you the ones that matter.
Confirmation email required. No spam, and every figure here stays free and public whether you subscribe or not. What you get, and how often →
Data: ERA5 (Copernicus Climate Change Service), 2026 preliminary; AEMET (Barcelona Fabra, station 0200E). Compiled by the floods desk.